In three earlier posts I pointed async-profiler at bugs I’d built on purpose, a regex quietly eating a core, a thread that was never actually idle, and a Hibernate session paying for changes it never made. Every time, I put up the flame graph and said “that’s the actual profiler output, not a mockup,” and moved on. What I never explained is why I trust that output at all, or why I reach for async-profiler instead of the sampler built into every JDK. So this one is the companion piece: not a bug, just how the tool works and why its picture of your program is the honest one.
Everything here I pulled from three write-ups I keep going back to: the async-profiler manual by Krzysztof Słusarski, Atlassian’s post on continuous JVM profiling, and a hands-on async-profiler walkthrough. Credit up front so nobody has to guess where the ideas came from.
The problem
You want to know where a Java program spends its time, so you attach a sampling profiler. Most of the classic ones, the sampler in VisualVM, anything built on JVMTI’s GetStackTrace, a shell loop around jstack, work the same way underneath: to read a thread’s stack safely, they wait until that thread is parked at a safepoint. A safepoint is a spot where the JVM knows the thread’s state is consistent enough to inspect, and the JIT only plants safepoint polls at specific places, mostly method returns and loop back-edges. Tight, hot, inlined code can run for a long time without passing one.
So here’s the trap. A thread is burning cycles deep inside some hot method that has no safepoint poll in it. The profiler wants a sample. It can’t read the stack where the thread actually is, so it waits, and the sample gets recorded only once the thread finally reaches the next safepoint, which might be a different method entirely. Every sample drifts toward wherever the safepoints happen to be. Your hottest code, the stuff with no safepoints because the JIT optimized it hard, is exactly the code that gets under-counted. This is safepoint bias, and it means the profile can point you at the wrong method with total confidence. You go optimize a getter while the real fire burns two frames down.
What async-profiler does instead
async-profiler doesn’t ask the thread to stop somewhere convenient. It gets the kernel to interrupt the thread wherever it is, with a signal, SIGPROF on a wall or CPU timer, or a perf_events overflow when you’re counting hardware cycles. Inside that signal handler it calls AsyncGetCallTrace, an undocumented-but-stable HotSpot entry point that walks the Java stack from an arbitrary point of execution, no safepoint required. The sample gets attributed to the frame the thread was really in when the timer fired, not the next safepoint it would have limped to.
Same instant, two profilers, two answers
GetStackTrace-based profiler has to wait for the next safepoint and books the sample there. The hotter and better-optimized the code, the fewer safepoints it has, and the more the biased profile under-counts it.One flag matters here. Those non-safepoint program counters need debug info to resolve back to line numbers and inlined frames, and the JIT only keeps that around if you ask. Run with -XX:+UnlockDiagnosticVMOptions -XX:+DebugNonSafepoints and the flame graph resolves cleanly; skip it and the hot JIT-compiled frames come back vague. It’s cheap, turn it on.
The four clocks
Once you can sample a stack from anywhere, “profiling” stops being one thing. A flame graph is just a pile of stacks counted up, and async-profiler will build that pile on top of whichever clock you hand it. The event you pick is the whole question you’re asking:
-e cpucounts CPU cycles viaperf_events. This is “what is the machine burning its cores on.” It only sees threads that are actually running.-e wallsamples every thread on a wall-clock timer whether it’s running or parked. This is “where does the elapsed time go,” including time spent blocked, sleeping, or waiting on something else.-e allocsamples allocations. New TLABs show up as one kind of frame, slow-path allocations that spilled straight into Eden as another. This is “what’s feeding the garbage collector.”-e locksamples threads waiting on monitors. This is “who’s stuck behind a lock, and which one.”
The CPU-versus-wall distinction is the one that has burned me in spirit even when the tool didn’t. The manual has a clean example: a request handler where CPU profiling makes mathConsumer() look like nearly the whole cost, because on the CPU clock it is, it’s the only part actually spinning a core. Switch to wall-clock and the same method is around 4% of the request, because the request spends the rest of its life waiting on an external system that never shows up on a CPU profile at all.
Same 100 requests, profiled on two different clocks
CPU clock: what's burning a core
Wall clock: where the time goes
cpu for a hot loop, wall for a slow request.The rule of thumb I use: reach for -e cpu when a core is pegged, and -e wall when a request is slow but nothing looks busy. They answer different questions and they will disagree, and the disagreement is usually the interesting part.
Reading the flame graph
The picture that comes out is the same shape regardless of clock. Every sample is a stack, drawn bottom-up with the entry point at the base and the leaf at the top. Identical frames sitting next to each other get merged into one wide bar, so width is share of the samples, which on the CPU clock means share of the time, on the alloc clock share of the bytes, on the lock clock share of the wait. The top edge is where the resource is actually being spent; everything below it is just the call chain that got there. You read it by scanning the top for the widest plateau and following it straight down to see who called it.
Here’s the CPU flame graph from the regex bug in the first post, the real one:
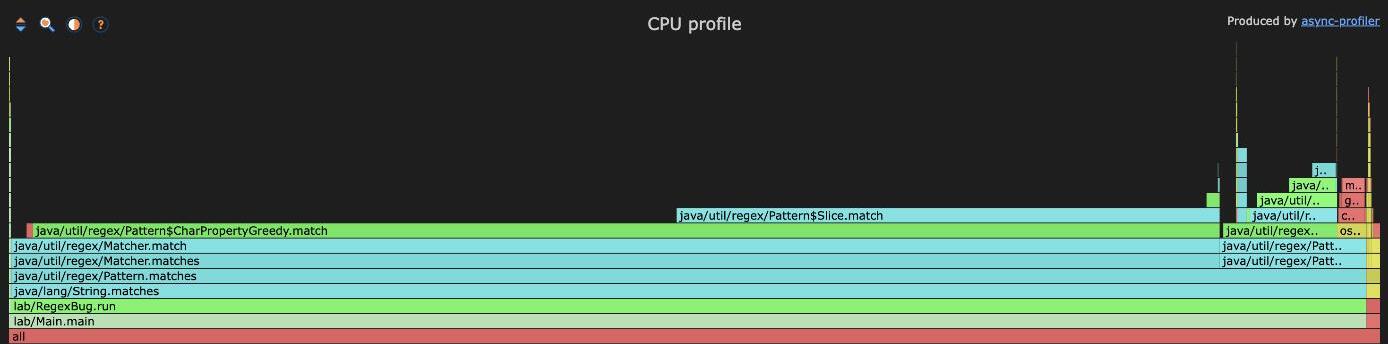
Two frames, Pattern$CharPropertyGreedy.match and Pattern$Slice.match, take up almost the entire width, stacked right above String.matches. That wide plateau at the top is the answer: the backtracking regex engine is where every cycle goes. There’s nothing to interpret, no counter to squint at, the shape just tells you. And because those samples came in through AsyncGetCallTrace and not a safepoint, the width is honest, the engine frames aren’t drifting somewhere else on the graph.
Why you’d leave it running
The last piece is the one I underrated for a long time. A profiler you attach during an incident only ever shows you incidents, and only the incidents slow enough that a human was around to attach it. Atlassian’s argument for continuous profiling is exactly that gap: someone or something has to be there to capture a profile at the right moment, so transient problems get missed entirely, and even when you do catch one you’ve got nothing to compare it against because you never profiled the healthy state.
Always-on flips it. You schedule async-profiler to dump stacks on a regular cadence, ship those samples somewhere columnar and cheap, Atlassian went with ORC files on S3 queried through Athena, and then you can slice any time window after the fact and diff it against a normal baseline. Overhead is the tax you’re paying for that, and it stays low enough to run in production because sampling a stack every few milliseconds is cheap next to the work the program is already doing.
Continuous profiling, end to end
The example that sold me: a code path that was under 0.5% of total runtime, invisible to any “show me the hot methods” view, quietly causing a latency regression because it spent twice as long BLOCKED as RUNNABLE. On a CPU profile it’s a rounding error. On aggregated wall-clock samples over time, with a baseline to compare against, it stands out. That’s a bug you cannot catch by attaching a profiler after someone complains, because by then you’ve lost the window and you never had the healthy one to diff against.
The takeaway
async-profiler earns its place by refusing to wait for a convenient moment. It interrupts the thread with a signal wherever it is and reads the stack through AsyncGetCallTrace, so the samples land on the code that’s actually running instead of drifting to the nearest safepoint the way jstack-style samplers do. Turn on -XX:+DebugNonSafepoints so those samples resolve to real frames. Then pick your clock deliberately: cpu when a core is pegged, wall when a request is slow, alloc when the GC is busy, lock when threads are stuck, they’re four different questions and the tool answers whichever one you asked. And if you only ever run it during an incident, you’ll only ever see incidents, and never the baseline that makes the small, slow, transient bugs visible. The flame graphs in my earlier posts were the honest picture for exactly these reasons, I just hadn’t said so.