If you’ve ever seen a consumer thread sitting at 90%+ CPU on a queue that’s basically empty, you’ve probably already guessed the bug before anyone opens a profiler: it’s polling in a tight loop with no backoff, and it’s spinning on nothing. I built exactly that this week, ten consumer threads each polling their own mostly-empty queue, one item arriving roughly every half second per queue. I went in expecting the flame graph to confirm the obvious story. It confirmed a slightly different one.
The problem
queue.poll() is non-blocking. It checks the queue, and if there’s nothing there, it returns null immediately, no waiting. Put that in a while(true) with nothing else in the loop body and you’ve built a thread that checks an empty queue as fast as the CPU will let it, forever, whether or not there’s ever anything to find. Each thread parks itself on exactly one core and holds it there. The usual fix is queue.poll(timeout, unit), the blocking overload, which parks the thread (LockSupport.park under the hood) until either an item shows up or the timeout elapses, so an idle consumer actually stays idle.
What I actually built
Ten consumer threads, one ArrayBlockingQueue each, a producer trickling one item into a queue roughly every 500ms per queue, one core per consumer on a 10-core host so the aggregate CPU number would actually mean something:
Integer item = fixed ? q.poll(50, TimeUnit.MILLISECONDS) : q.poll();
Same 35-second run, same producer rate, same queues. The only difference is which overload of poll() gets called.
The number that did move
Unlike the regex bug, this one is exactly as dramatic on CPU% as the reputation suggests:
CPU load, bad vs fixed (10 consumer threads, 10-core host)
And the job really is the same job. Both variants delivered the identical 70 items over the run, the producer’s rate doesn’t change based on how the consumer polls. What changes is how many times each consumer asks: the non-blocking version polled its queue 47.56 billion times combined across ten threads to move those 70 items. The blocking version asked 6,572 times, total, for the identical result. That gap, 47.56 billion vs 6,572, is the whole bug in one comparison.
What the flame graph actually shows
This is where I was wrong going in. I expected the bad flame graph to be dominated by the loop body itself, an empty while spinning on null. It isn’t.
Where the "bad" run's CPU samples land
AbstractQueuedSynchronizer.signalNext is more than three-quarters of the samples, and SpinBug’s own loop body, the code I actually wrote, is only about 15%. What’s burning the core isn’t idling, it’s ArrayBlockingQueue’s internal ReentrantLock getting acquired and released billions of times a second by a thread that has nothing to do with the result each time. Ten threads spinning at that rate against ten separate queues still means real, measurable contention machinery running underneath something that looks, from the outside, like plain idling.
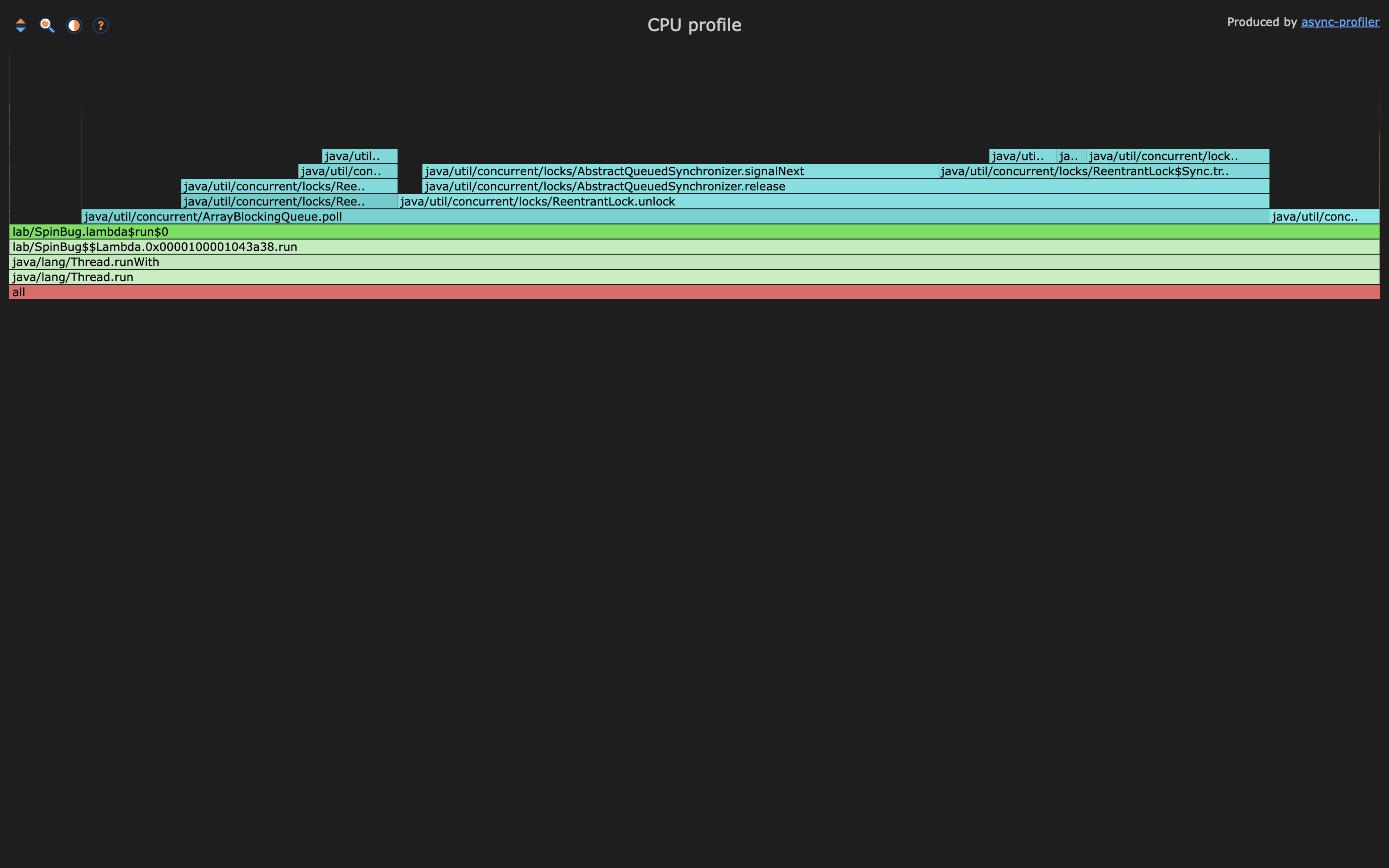
AbstractQueuedSynchronizer.signalNext and its neighboring ReentrantLock$Sync/AbstractQueuedSynchronizer.release frames run nearly the full width of the graph, sitting above ArrayBlockingQueue.poll. SpinBug.lambda$run$0, the loop I actually wrote, is the thin sliver underneath carrying all of it. Here’s the same ten threads with the blocking poll(50ms) instead:
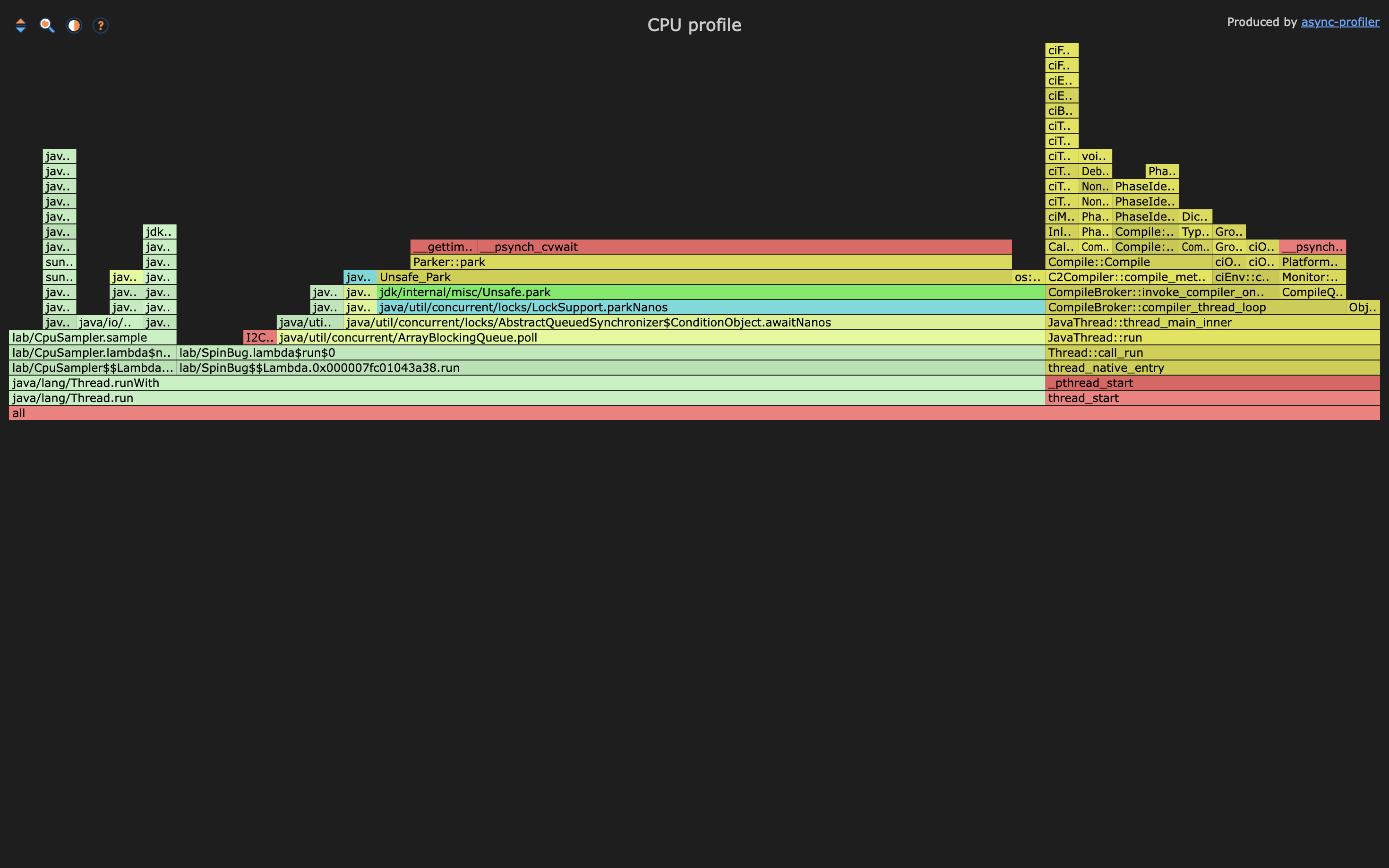
Almost the entire stack is LockSupport.parkNanos and Unsafe_Park down into the OS-level Parker::park. The thread isn’t running at all for most of the sample window, it’s parked, which is exactly what “idle” is supposed to look like and exactly what the bad run never actually achieved.
That’s a more useful lesson than “spinning wastes CPU,” which everyone already knows. The specific thing it’s wasting CPU on is lock acquisition overhead for a lock nobody needed to take.
Stuff worth remembering
- A non-blocking
poll()in a hot loop doesn’t just waste cycles on “nothing,” it drives real lock traffic against the queue’s internals every single iteration. That’ssignalNextand friends, not an empty branch. - The fix is one word: use the blocking overload with a timeout.
queue.poll(50, TimeUnit.MILLISECONDS)instead ofqueue.poll()took this from 91.8% to 0.2% CPU for the exact same throughput. - Don’t assume you know what a flame graph will show before you’ve looked. I expected an empty loop body at the top and got synchronizer internals instead.
- These are laptop numbers demonstrating the mechanism, the lab and its flame graphs are in the repo. Same switchable project as the regex bug, plus a Hibernate session that pays for changes it never made.
The takeaway
A busy-spin loop reads as “doing nothing, fast” and the fix reads as obvious once you know it: block with a timeout instead of polling non-blocking. What the flame graph adds is the part nobody tells you in the one-line summary, that the CPU isn’t idling in your code, it’s fighting over a lock in code you didn’t write, billions of times a second, for a queue that had one item to offer every half second. If you only fix the CPU number, you’d walk away thinking spinning burns cycles doing nothing. It’s burning cycles doing something, just nothing useful, and that distinction is only visible once you actually look.