I first ran into this shape of bug secondhand, in someone else’s writeup about existsById() costing 95% CPU in a service that looked, on paper, like it was running a cheap indexed lookup. I remember thinking that number had to be exaggerated. It isn’t. I built a much smaller version of the same trap this week, a Hibernate session holding 8,000 managed entities and one tiny query run against it, and watched the identical SQL statement run 640 times slower depending on a single flush-mode setting I hadn’t touched.
The problem
Before Hibernate runs any query, it has to make sure the database reflects whatever’s pending in memory, otherwise your query could read stale data. With the default FlushMode.AUTO, that means a flush before every single query, and a flush means dirty-checking every managed entity currently in the session, comparing each one’s current field values against the snapshot Hibernate took when it was loaded. If your session is holding a handful of entities, that’s free. If it’s holding thousands, because you’re in a long batch job, or a request handler that touched a lot of rows and never cleared the session, every query you run pays for a full scan of everyone else’s potential changes before it’s allowed to execute at all. A one-row SELECT becomes O(N) work, and N is however many entities happen to be sitting in memory at the time, not anything related to the query itself.
What I actually built
Plain Hibernate against an in-memory H2 database, no Spring involved, so there’d be no framework magic to argue about. I persisted 8,000 entities into a single still-open session, keeping them all managed, and then ran a tiny indexed lookup against random ids for 35 seconds:
Long r = session.createQuery(
                "select w.id from WidgetEntity w where w.id = :id", Long.class)
        .setParameter("id", id)
        .uniqueResultOptional()
        .orElse(null);
hibernate-bad runs that with Hibernate’s default FlushMode.AUTO left alone. hibernate-fixed sets one line before the loop starts:
session.setHibernateFlushMode(FlushMode.COMMIT);
That’s the entire diff. Same query, same session, same 8,000 entities, same random ids.
The number that didn’t move (again)
Same story as the regex bug: CPU% is nearly worthless here.
CPU load, bad vs fixed (single-threaded, 10-core host)
This is the second time in this lab that a flat CPU graph hid a real problem, and it’s not a coincidence: any single-threaded hot loop is going to peg its one core whether it’s doing useful work or wasted work, and top can’t see the difference. What can see the difference is throughput, and here it isn’t subtle:
Checks per second, bad vs fixed
640.7x, for one line of code, against a session holding 8,000 entities. Scale the entity count up, or run this in a request handler that accumulates a bigger persistence context over its lifetime, and the multiplier only gets worse, because the dirty-check cost is O(N) and N is whatever’s currently managed, not anything the query itself controls.
What the flame graph actually shows
The bad flame graph doesn’t have one dominant frame the way the regex bug did. It’s spread across the flush machinery itself:
Where the "bad" run's CPU samples land
Field.get is reflection pulling each managed entity’s current field values so they can be compared against what Hibernate loaded them with. Long.equals is that comparison. AbstractFlushingEventListener.prepareEntityFlushes, Cascade.cascade, DefaultFlushEntityEventListener.performDirtyCheck, and DirtyHelper.findDirty are the flush event pipeline itself, walking the persistence context entity by entity. None of that is the SELECT. The actual query, the thing the code visibly asks for, doesn’t even register as a named hot frame, it’s buried in whatever’s left in “everything else.” The bug isn’t in the query. It’s in everything that has to happen before Hibernate will let the query run.
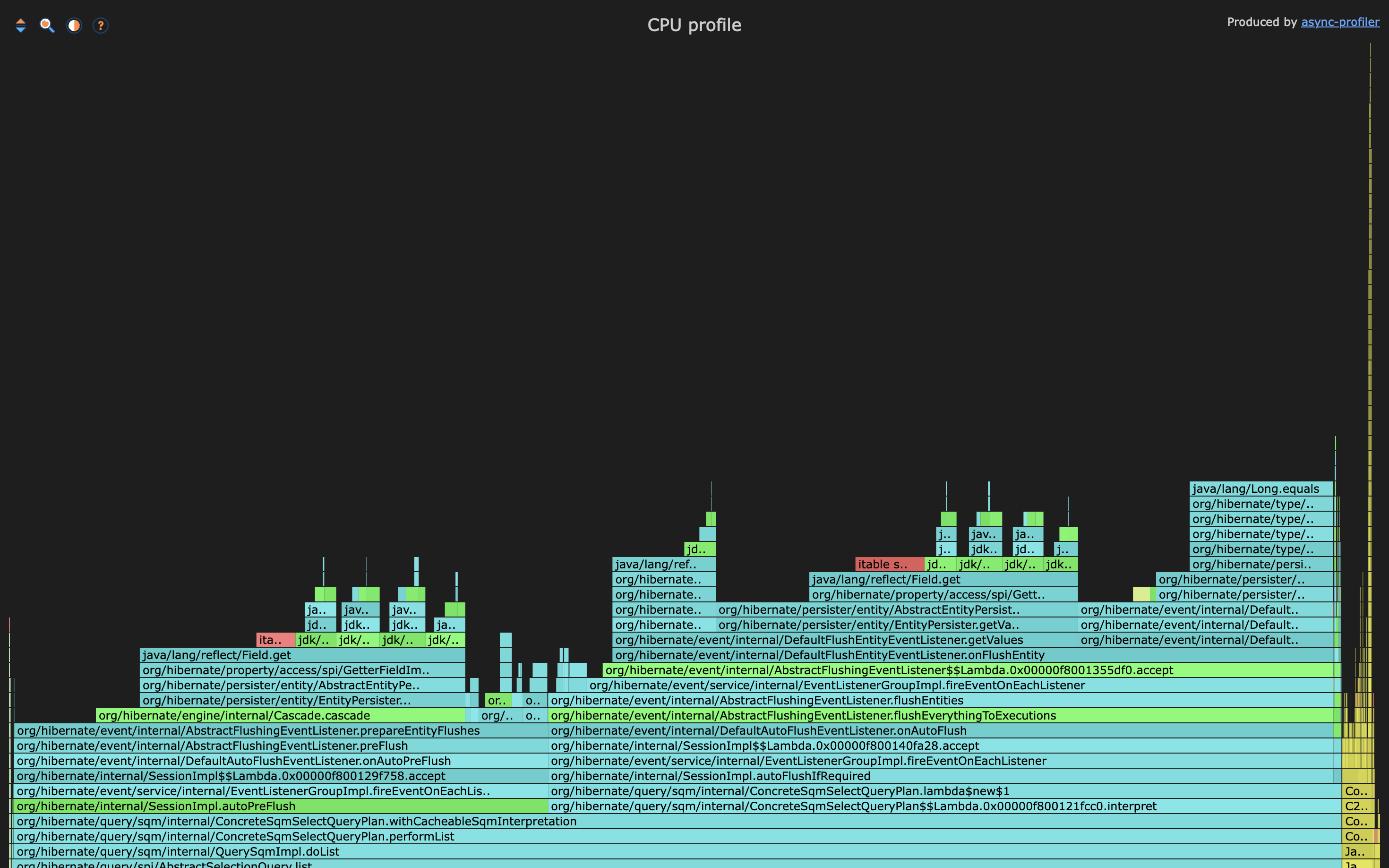
AbstractFlushingEventListener.flushEverythingToExecutions, Cascade.cascade, DefaultFlushEntityEventListener.onFlushEntity, EntityPersister.getPropertyValues, all of it Hibernate’s own flush pipeline, fills most of the width above autoPreFlush and autoFlushIfRequired. The query that actually runs is the narrow strip on the far right. Here’s the same lookup with FlushMode.COMMIT set:
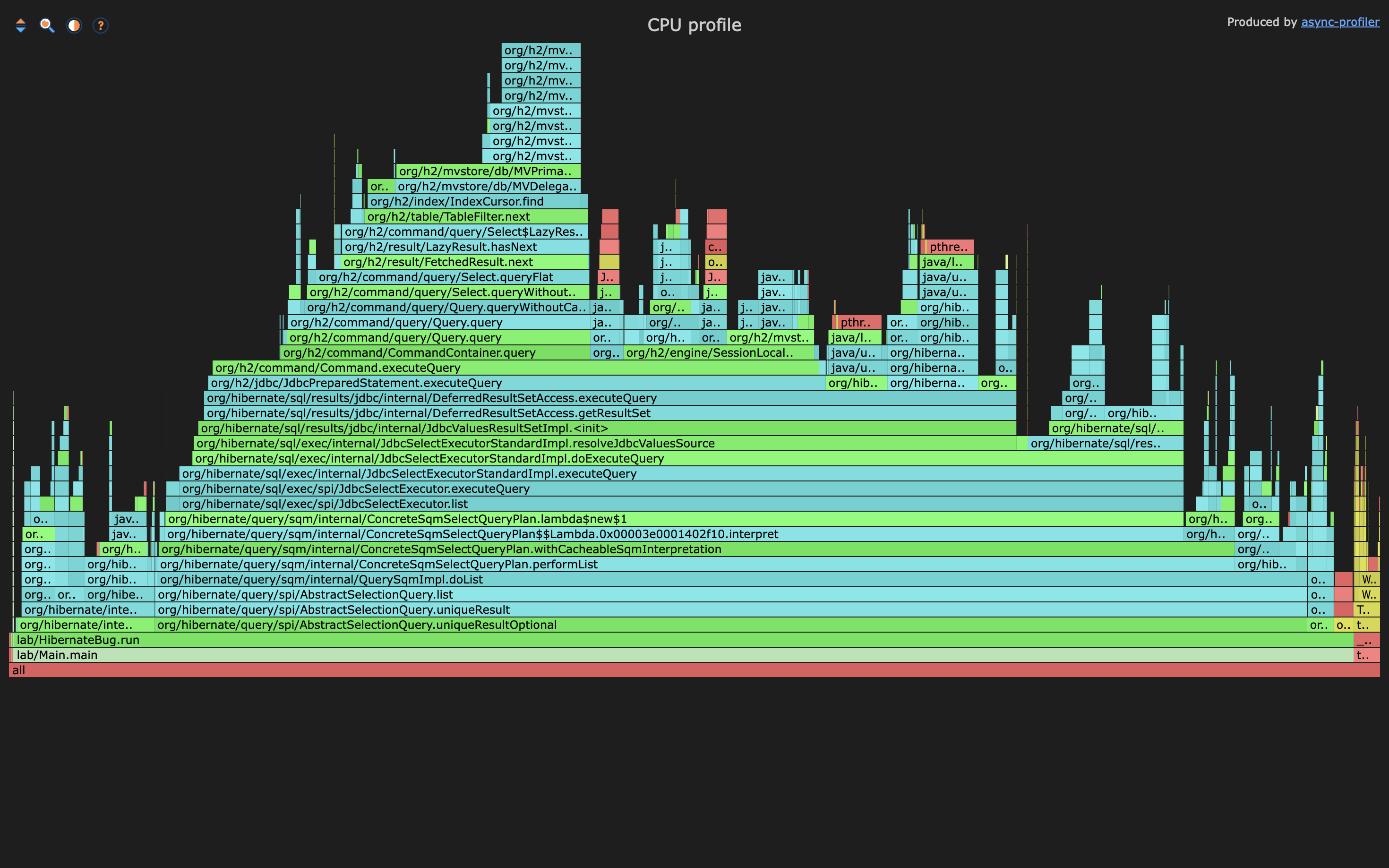
No flush frames anywhere. What’s left is what the query actually costs: H2’s own IndexCursor.find, TableFilter.next, and the MVStore/MVPrimaryIndex b-tree lookup underneath it, plus the JDBC and Hibernate SQL-execution plumbing that has to run for any query regardless of flush mode. This is what a one-row indexed SELECT is supposed to look like on a flame graph.
Stuff worth remembering
FlushMode.AUTOmeans every query pays for a full dirty-check of the whole persistence context first, and that cost scales with however many entities happen to be managed, not with the query.session.setHibernateFlushMode(FlushMode.COMMIT)(orMANUAL, if you’re comfortable flushing yourself) skips that pre-query flush entirely. One line, 640.7x throughput, same SQL.- Watch for this in long-lived sessions specifically: a batch job or a request handler that keeps accumulating managed entities without ever clearing or evicting them is exactly the shape that turns a cheap query slow.
- CPU% flattened out identically in this bug and the regex bug in this same lab. Two bugs, two flat CPU graphs, two real problems that only showed up in throughput and the flame graph. That’s not a coincidence, it’s what single-threaded CPU-bound code always looks like from the outside.
- These are laptop numbers demonstrating the mechanism, the lab and its flame graphs are in the repo, alongside the regex and busy-spin bugs from the same switchable project.
The takeaway
existsById()-style checks look free because the SQL behind them is free. What isn’t free is everything Hibernate does before it’s willing to run that SQL, and with the default flush mode, that’s a full dirty-check of your entire persistence context, every single call. The fix costs one line and changes no business logic at all, FlushMode.COMMIT instead of the default AUTO, but you won’t find it by staring at CPU% or even at the query itself. You find it by asking a profiler what’s actually running underneath the call you can see, and in this case what’s running underneath is thousands of field comparisons for changes that were never there.