I’d read the same story a handful of times on different blogs: someone’s log-scanning code is quietly eating a core, they pull a flame graph, and the whole thing is Pattern.match wearing a costume. I always nodded along and never once opened a profiler myself to watch it happen. So this week I built the bug on purpose, in a small Java program with nothing else running on it, and pointed async-profiler at it until I had my own numbers instead of someone else’s screenshot.
The problem
Somewhere in a log-scanning hot path, someone wants to know if a line contains the word “ERROR”. The obvious-looking way to write that in Java is line.matches(".*ERROR.*"). It reads fine, it’s correct, and it’s slower than it has any reason to be, because String.matches() already requires the entire input to match the pattern; the .* on either side of ERROR is dead weight. Java’s regex engine is a backtracking NFA, not a DFA, so for every line that does not contain “ERROR” (the common case in a healthy service log) it still has to try anchoring the literal at every offset before it can give up. That’s the bug people mean when they say “unanchored regex,” and it’s the one from the classic async-profiler war stories.
What I actually built
Two variants of the same loop, matching against the same pool of 2,000 synthetic log lines (about 5% real ERROR lines, the rest ordinary INFO/DEBUG noise), each run for a fixed 35 seconds:
boolean isMatch = fixed
        ? line.contains("ERROR")                 // O(n) single pass
        : line.matches(".*ERROR.*");              // unanchored, backtracking-heavy full match
Sampling getProcessCpuLoad() once a second and counting lines processed was the whole measurement. Then I ran each variant under asprof -e cpu for a real flame graph instead of guessing at what the engine was doing internally.
The number that didn’t move
Here’s the part that would have fooled me if I’d only had top open. Process CPU load, averaged over the run:
CPU load, bad vs fixed (process CPU, normalized to 1 core of 10)
Both variants are single-threaded and both keep one core continuously busy the whole run, so on a 10-core host that’s ~10% of total capacity either way, whether that core is doing useful work or not. If a teammate had paged me with “CPU looks fine, must be something else,” I’d have believed them. CPU% measures how busy the machine is, not what it’s busy doing, and that distinction is the entire reason this bug is worth writing about.
Throughput is where the bug actually shows up:
Lines matched per second, bad vs fixed
Same core, same 35 seconds, 8x fewer lines checked. That’s the cost of the backtracking, and it’s invisible to anything that only watches CPU%.
What the flame graph actually shows
The bad flame graph isn’t subtle once you open it. Two frames account for about 88% of all samples:
Where the "bad" run's CPU samples land
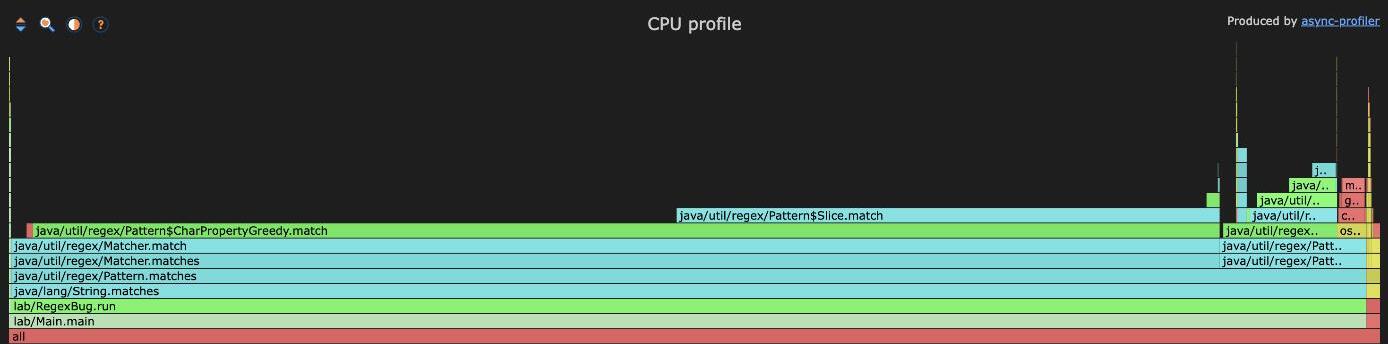
That’s the actual async-profiler flame graph, not a mockup. Pattern$CharPropertyGreedy.match and Pattern$Slice.match sit stacked directly above Matcher.match, Pattern.matches, and String.matches, exactly where you’d expect the backtracking cost to show up. Here’s the same 35 seconds with String.contains() instead:

No Pattern or Matcher frames anywhere. What little stack there is belongs to the clock calls the CPU sampler itself makes once a second. The regex engine simply never gets invoked.
CharPropertyGreedy.match is the greedy quantifier doing its backtracking, Pattern$Slice.match is the literal-string matcher it keeps re-invoking against the shifted offset. Nothing else in the call stack gets a look-in. regex-fixed’s flame graph, by contrast, barely has a call stack worth mentioning; String.contains() is a single pass and doesn’t leave much of a shadow.
Stuff worth remembering
- CPU% alone can’t tell you a single-threaded hot loop is doing 8x less work than it should. Throughput or wall-clock-per-unit-of-work is the number that actually moves.
String.matches()already anchors the whole string. Wrapping the pattern in.*on both sides changes nothing about correctness and costs you the backtracking engine’s worst case.- A flame graph turns “the CPU is busy” into “the CPU is busy doing this specific, nameable thing,” which is the whole reason to reach for one before reaching for more hardware.
- These are laptop numbers demonstrating the mechanism, the lab and its flame graphs are in the repo. It’s a small switchable Maven project with two more bugs in it, a spinning thread that isn’t actually idle and a Hibernate session that pays for changes it never made, both worth their own look.
The takeaway
If you’re debugging a CPU problem and top -H says the number is fine, that only tells you nobody’s core is pegged past what you’d expect, not that the work happening on that core is worth doing. The regex bug here didn’t move CPU% at all, bad and fixed sat within a rounding error of each other, and the only way to see that eight out of every nine lines of throughput had gone missing was to look at what the CPU was actually spending its cycles on. Anchor your patterns, or better, skip the regex engine entirely when a plain substring check does the same job, and don’t trust a flat CPU graph to mean nothing’s wrong.